Certifications PMP CertificationWorld’s top PM cert CSM: Certified ScrumMasterTop agile cert CAPMEntry-level PM cert PRINCE2UK & Europe standard View All Certifications ?
PM Guides Agile GuideComplete breakdown Scrum GuideRoles, ceremonies, artifacts EVM GuideAll formulas explained View All Guides ?
Career & Salary PM Salary 2026By country & level How to Become a PMStep-by-step roadmap 50 Interview QuestionsWith strong answers
PM Software Monday.com ReviewTop pick 2026 ClickUp ReviewBest value Best Free PM ToolsNo trials, truly free View All Software ?
Free Tools & Templates EVM CalculatorFree, no signup Gantt Chart MakerBuild & export free PMP Eligibility Checker30-second result Free PM Templates30 templates in Excel, Word and PDF
Get the Free PMP Guide ?

Project Quality Management: All 3 PMBOK Processes, 7 Quality Tools and Cost of Quality

By Syed Mujeeb Ur RehmanUpdated

What Is Project Quality Management?

Project Quality Management is Knowledge Area 5 in PMBOK 6 (its processes are numbered 8.1 to 8.3 because they sit in chapter 8 of the guide). It has three processes: Plan Quality Management (decide the standards and how you will prove you met them), Manage Quality (make sure the way you work produces good results) and Control Quality (check the finished deliverables). The big idea is simple: prevention is cheaper than inspection. Build quality in, do not try to inspect it in at the end. The Cost of Quality, the seven basic quality tools and improvement models like PDCA and Six Sigma are the tools you use to do this.

✦
From my experience: On my construction projects in the UAE, quality was decided long before inspection day. The jobs that went well had a plan that named who checks what, at which hold point, before the consultant or the authority inspector arrived. The jobs that went badly found problems at the snag list stage, when fixing them cost the most. When I teach this to my PMP students, I tell them to think the same way: the exam always rewards the answer that stops the defect early.

This page is my exam-focused view of quality: the processes, the tools and the traps PMI likes to test. If you want a ready-to-use document for your own project, use my quality management plan template instead. This page is for understanding the concepts and passing the exam.

Quality is the most misunderstood knowledge area. In daily life "quality" means premium or excellent. In project management it has a precise meaning: the degree to which a set of inherent characteristics fulfils requirements. If you deliver exactly what was agreed, to the agreed standard, that is a quality project, even if the product is basic. If you deliver something fancy but different from what was agreed, that is not.

So your job is not to deliver the best possible product. It is to deliver the right product, as the requirements define it, every time, and to be able to prove it.

On this page you will find the three PMBOK processes with their inputs, tools and outputs, the Cost of Quality, the seven basic quality tools, quality vs grade, prevention vs inspection, improvement models, quality in agile and hybrid projects, and exam tips.

Foundational Concepts

What is the difference between quality and grade?

Before the three processes, learn two distinctions. Both come up on the PMP exam and the APM PMQ.
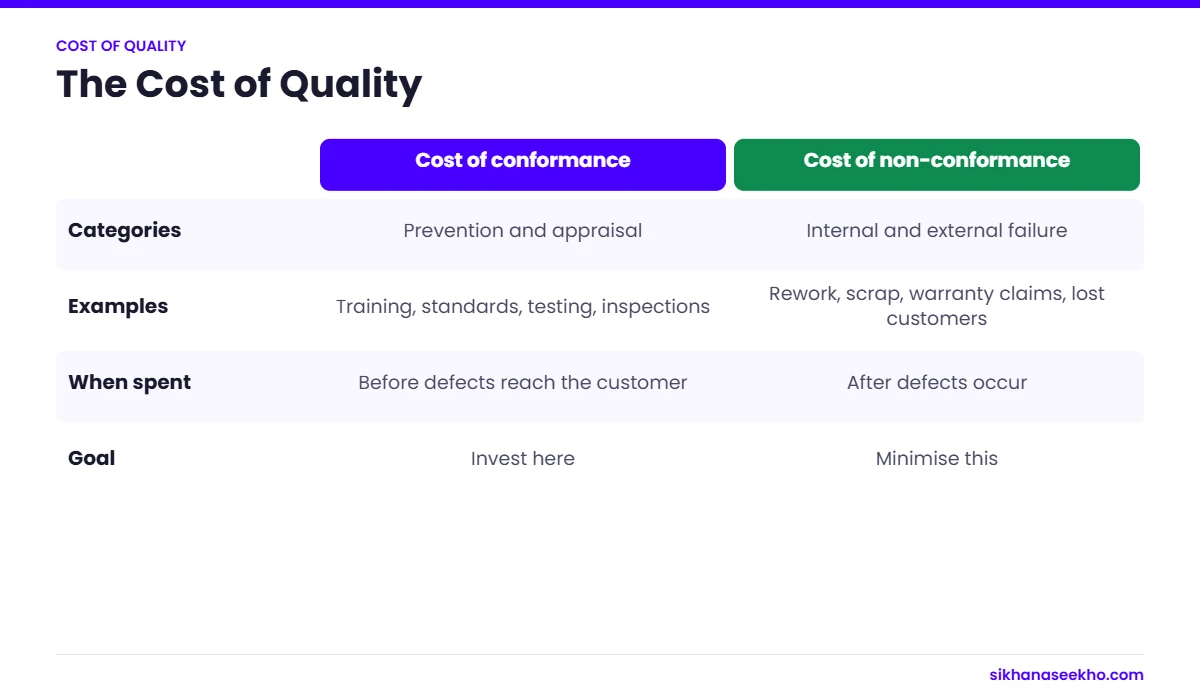
Cost of quality table comparing cost of conformance (prevention and appraisal) with cost of non-conformance (internal and external failure)
Money spent on prevention reduces the far higher cost of failure.
Quality
Quality is the degree to which a set of inherent characteristics fulfils requirements. A deliverable is high quality if it meets its specified requirements consistently and reliably. Quality is about conformance to specification: does it do what it was supposed to do, to the standard it was supposed to do it to? Low quality is always a problem. A product that fails its requirements is not fit for purpose, regardless of how basic or advanced those requirements are. Poor quality has direct cost consequences: rework, defect correction, warranty claims, customer dissatisfaction.
Grade
Grade is a category assigned to products or services having the same functional use but different technical characteristics. A budget hotel and a five-star hotel both have a grade: low grade and high grade respectively. Low grade is not necessarily a problem: if the customer requires and has agreed to a low-grade product, delivering a low-grade product that meets all specified requirements is a quality outcome. The PMP exam frequently tests the distinction: low quality is always a problem; low grade is only a problem if the customer required high grade. A high-grade product that does not meet requirements is low quality, and that is always a problem.
✦
Prevention over inspection: the main rule of quality management. Prevention means building quality into the work from the start: clear requirements, training, peer reviews and good process design. Inspection means checking the work after it is done and removing defects. A defect found while writing the requirements is cheap to fix. The same defect found in testing costs more, and found by the customer it costs the most. The Cost of Quality framework below shows why.

Precision vs Accuracy: Another Tested Distinction

Accuracy means how close a result is to the target. Precision means how close the results are to each other, whether or not they hit the target. A process can be precise but not accurate (it gives the same wrong result every time), accurate but not precise (right on average but all over the place), or both, which is what you want. Example: a machine that always cuts parts 2mm too long is precise but not accurate, so you recalibrate it. A machine that varies a lot around the target is accurate on average but not precise, so you improve the process.

The Three Processes

Project Quality Management: The 3 PMBOK Processes

8.1
Plan Quality Management
Planning Process Group · Identifies quality requirements and standards; defines how quality will be achieved and verified
+

Plan Quality Management is where you decide which quality requirements and standards apply, and how you will show that you met them. Its main output is the Quality Management Plan, part of the project management plan. It sets out the standards, the quality objectives, who does which quality activity, the tools you will use, how you will check the work and what happens when something does not conform.

Key activities in Plan Quality Management include:

  • Benchmarking: Comparing planned quality practices or the project's characteristics with comparable projects or organisations to identify best practices and establish performance improvement targets.
  • Cost-benefit analysis: Evaluating the trade-off between the cost of quality activities (prevention and appraisal) and the benefits (reduced rework, customer satisfaction, reduced warranty costs). The core argument for quality investment: prevention costs less than cure.
  • Cost of Quality (CoQ) analysis: Identifying and estimating the costs of both conformance (doing it right) and non-conformance (fixing it when it is wrong). See the full CoQ framework below.
  • Logical data models: Mapping data flows to identify quality requirements for information assets.
  • Quality function deployment (QFD): A technique that translates customer wants and needs into project and product technical requirements.

The plan also sets the quality metrics: the measurable checks you will use. Examples: defects per 1,000 lines of code, first-pass yield (the percentage of items that pass inspection first time), on-time delivery rate or customer satisfaction score. Without metrics, quality becomes an opinion instead of a measurement.

Inputs
  • Project Charter
  • Project Management Plan (Requirements, Risk, Stakeholder engagement)
  • Project Documents (Assumptions log, Requirements docs, Risk register, Stakeholder register)
  • Enterprise Environmental Factors
  • Organisational Process Assets
Tools & Techniques
  • Expert judgement
  • Data gathering (benchmarking, brainstorming, interviews)
  • Data analysis (cost-benefit analysis, CoQ)
  • Decision making (multi-criteria decision analysis)
  • Data representation (flowcharts, logical data models, matrix diagrams)
  • Test and inspection planning
  • Meetings
Outputs
  • Quality Management Plan
  • Quality Metrics
  • Project Management Plan Updates
  • Project Documents Updates
8.2
Manage Quality
Executing Process Group · Translates the Quality Management Plan into executable quality activities; focuses on process quality
+

Manage Quality was called "Perform Quality Assurance" in older PMBOK editions. It is an executing process. Plan Quality Management asks "which standards apply and how will we meet them?" Manage Quality asks "are our processes working as planned, and how can we make them better?" The focus is on process quality: making sure the way the team works produces good outputs. Checking individual deliverables is Control Quality's job.

The main tool here is the quality audit: a structured, independent review that checks whether the team follows the processes in the quality plan, and whether those processes actually work. Audits can be internal or external, and they often end with recommendations for improvement.

Process analysis looks for ways to improve a process by removing waste, reducing variation and cutting steps that add no value. This links to Lean and Six Sigma. The result is often a change request to fix a process that keeps producing defects.

Manage Quality also produces the Quality Report: a summary of quality activities, audit findings, issues, non-conformances and recommended corrective actions. It feeds Control Quality and wider project decisions.

Inputs
  • Project Management Plan (Quality Management Plan)
  • Project Documents (Lessons learned register, Quality control measurements, Quality metrics, Risk report)
  • Organisational Process Assets
Tools & Techniques
  • Data gathering (checklists)
  • Data analysis (alternatives analysis, document analysis, process analysis, root cause analysis)
  • Decision making (multi-criteria decision analysis)
  • Data representation (affinity diagrams, cause-and-effect, flowcharts, histograms, matrix diagrams, scatter diagrams)
  • Audits
  • Design for X (DfX)
  • Problem solving
  • Quality improvement methods (PDCA, Six Sigma)
Outputs
  • Quality Report
  • Test and Evaluation Documents
  • Change Requests
  • Project Management Plan Updates
  • Project Documents Updates
8.3
Control Quality
Monitoring & Controlling Process Group · Monitors and records results of quality activities; identifies defects and drives corrections
+

Control Quality is where you check the deliverables. You inspect, test and measure the actual outputs to confirm they meet the requirements in the quality plan, and you record the results. Manage Quality looks at processes. Control Quality looks at deliverables. This is the inspection side of quality management.

Control Quality uses the seven basic quality tools (see the next section) to analyse data, spot defect patterns and find root causes. It produces Quality Control Measurements, which go back into Manage Quality so the team can improve its processes.

Key concepts in Control Quality:

  • Verified deliverables: The primary output: deliverables that have been checked against quality requirements and confirmed to meet them. Verified deliverables then flow into Validate Scope (Scope Management) for formal acceptance by the customer.
  • Prevention vs inspection: Control Quality is an inspection activity. It detects defects after they are created. Manage Quality is a prevention activity. It works to eliminate the conditions that cause defects. Both are necessary, but investments in Manage Quality (prevention) typically reduce the burden on Control Quality (inspection).
  • Tolerances vs control limits: Tolerances are the acceptable range specified by the customer or stakeholder (the specification limits). Control limits are statistically determined boundaries within which a process is considered in statistical control. A process can be within control limits yet outside tolerances (the process is stable but wrong) or within tolerances yet outside control limits (the process is meeting requirements but showing signs of instability).
Inputs
  • Project Management Plan (Quality Management Plan)
  • Project Documents (Lessons learned register, Quality metrics, Test and evaluation documents)
  • Approved Change Requests
  • Deliverables
  • Work Performance Data
  • Enterprise Environmental Factors
  • Organisational Process Assets
Tools & Techniques
  • Data gathering (checklists, check sheets, statistical sampling, questionnaires)
  • Data analysis (performance reviews, root cause analysis)
  • Inspection
  • Testing / product evaluations
  • Data representation (cause-and-effect, control charts, histograms, scatter diagrams)
  • Meetings
Outputs
  • Quality Control Measurements
  • Verified Deliverables
  • Work Performance Information
  • Change Requests
  • Project Management Plan Updates
  • Project Documents Updates
Cost of Quality

The 3 quality management processes at a glance

ProcessProcess groupKey output
Plan Quality ManagementPlanningQuality management plan and quality metrics
Manage QualityExecutingQuality reports and test and evaluation documents
Control QualityMonitoring and ControllingQuality control measurements and verified deliverables

Source: PMBOK Guide, 6th edition (PMI).

The Cost of Quality Framework

The Cost of Quality (CoQ) splits every quality-related cost into two groups. The cost of conformance is money you spend to prevent defects and check the work. The cost of non-conformance is money you spend because the work was not right. This framework is how you make the business case for quality, and it is a regular PMP exam topic.

Cost of Quality: Complete Framework
Cost of Conformance (Good Money)
Prevention Costs: to avoid failures
  • Quality training and education
  • Process documentation and standardisation
  • Quality planning and requirements definition
  • Supplier qualification and evaluation
  • Equipment maintenance and calibration
  • Peer reviews and design reviews
  • Process improvement initiatives
Appraisal Costs: to assess quality
  • Testing (unit, integration, system, acceptance)
  • Inspections and audits
  • Destructive testing and sampling
  • Quality measurements and data collection
  • Supplier audits
Cost of Non-Conformance (Bad Money)
Internal Failure Costs: found before delivery
  • Rework: fixing defects found internally
  • Scrap: discarding defective work
  • Retesting after rework
  • Downtime caused by quality failures
  • Root cause analysis for internal failures
  • Schedule recovery costs caused by rework
External Failure Costs: found after delivery
  • Warranty claims and product recalls
  • Liability costs and legal fees
  • Customer complaint handling
  • Loss of future business (reputational damage)
  • Emergency field fixes and patches
The main principle: the later you find a defect, the more it costs to fix. A design error caught in a review costs a little time. The same error caught at testing means rework. Caught by the customer, it means rework, delays, warranty claims and a damaged reputation. Every pound you spend on prevention and appraisal saves a much larger amount of failure cost. That is the business case for building quality in early instead of inspecting it at the end.
The Seven Quality Tools

The Seven Basic Quality Tools

PMBOK lists seven basic quality tools, often called the "7 QC tools". They came from Japanese quality management. Each one helps with a different kind of quality problem, from collecting data to finding root causes to deciding what to fix first.

✦Cause-and-Effect Diagram (Fishbone / Ishikawa)
A structured brainstorming tool that maps potential causes of a quality problem (the effect) in a visual fishbone structure. Causes are typically organised into categories: in manufacturing: Machine, Method, Material, Measurement, Man, Environment (the 6Ms). In software/services: People, Process, Technology, Environment, Management. The diagram forces systematic exploration of all potential root causes rather than jumping to the most obvious one.
Root cause analysis of defects and process failures
✦Control Chart (Run Chart)
A time-series chart that plots process measurement data against statistically calculated Upper Control Limit (UCL) and Lower Control Limit (LCL), typically set at ±3 standard deviations from the mean. Data points within control limits indicate a stable, predictable process. Data points outside control limits, or non-random patterns within limits (7 consecutive points on one side of the mean = "Rule of 7"), indicate assignable causes that must be investigated. The control chart distinguishes between common cause variation (inherent, random) and special cause variation (assignable, correctable).
Monitoring process stability over time; identifying when intervention is needed
✦Flowchart (Process Map)
A visual representation of a process showing the sequence of steps, decision points, inputs and outputs. Flowcharts make process logic visible: enabling the team to identify where defects are most likely to be introduced, where process steps are redundant or missing, and where quality control checkpoints should be positioned. In quality management, flowcharts are used both for process design (Plan Quality Management) and process analysis (Manage Quality: identifying waste and improvement opportunities).
Process design, waste identification, quality checkpoint placement
✦Histogram
A bar chart that shows the frequency distribution of a dataset: how often values fall within defined intervals. In quality management, histograms reveal whether a process output is centred on the target, how much variation exists, whether the distribution is normal, and whether output is skewed toward the upper or lower specification limits. A histogram can reveal that a process is producing output that is statistically within specification on average but with a distribution that will regularly breach the upper limit.
Analysing the distribution and variation of process outputs
✦Pareto Chart (80/20 Rule)
A bar chart that ranks defect types or causes by frequency (or cost) in descending order, with a cumulative percentage line overlaid. Based on Vilfredo Pareto's observation that roughly 80% of effects come from 20% of causes. In quality management, the Pareto chart tells the quality team: which defect types account for the majority of failures, and therefore where to focus corrective action for maximum impact. Fixing the top three defect categories on a Pareto chart will typically address more than half of all defects.
Prioritising which defect categories to address first for maximum impact
✦Scatter Diagram (Correlation Chart)
A two-dimensional chart that plots pairs of data values to reveal whether a relationship (correlation) exists between two variables. In quality management, scatter diagrams test hypotheses like "does higher ambient temperature correlate with more defects?" or "does longer test duration correlate with fewer escaped defects?" A positive correlation (data points trending upward from left to right) suggests a relationship that may indicate a cause-and-effect connection, though correlation is not causation and further analysis is needed to confirm.
Testing hypotheses about relationships between process variables and quality outcomes
✦Checklist (Check Sheet)
A structured data collection tool used to systematically gather and organise data. In quality management, checklists serve two purposes: as a verification checklist (ensuring all required steps have been completed before a deliverable is approved) and as a check sheet (a tally sheet that records how often each defect type occurs during a defined observation period). Check sheets feed directly into Pareto analysis, the frequency tallies become the data for the Pareto chart's defect ranking.
Verifying completion of required steps; collecting defect frequency data
Continuous Improvement

Continuous Improvement Models in Project Quality Management

Quality Improvement Frameworks: Referenced in PMBOK
PDCA: Plan-Do-Check-Act (Deming Cycle)
The basic improvement loop. Plan: find the problem and design a fix. Do: try the fix on a small scale. Check: measure whether it worked. Act: make the change standard and roll it out. Each cycle improves one process. Manage Quality is really PDCA applied to the project's processes.
Six Sigma: DMAIC and DMADV
Six Sigma aims for fewer than 3.4 defects per million opportunities. It uses DMAIC (Define, Measure, Analyse, Improve, Control) to improve existing processes and DMADV (Define, Measure, Analyse, Design, Verify) to design new ones. Both rely on data and statistics to find and remove the causes of variation. You see it most in manufacturing, healthcare and finance, where very low defect rates are needed.
Lean: Eliminate Waste
Lean focuses on customer value and removing the eight types of waste (TIMWOODS: Transport, Inventory, Motion, Waiting, Overproduction, Over-processing, Defects, Skills not used). For a project manager, Lean asks a simple question: does this quality activity add value, or is it just paperwork? Value stream mapping shows the flow of work and where waste happens, including too much inspection that better process design could replace.
Total Quality Management (TQM)
TQM makes quality everyone's job, at every level, not only the quality department's. W. Edwards Deming and Joseph Juran are the names linked to it. Its main ideas are customer focus, continuous improvement, involving employees, decisions based on facts and a process approach. TQM is more a culture than a method, and PMBOK's approach to quality is built on it.
Prevention vs Inspection

Why is prevention better than inspection?

Prevention (Manage Quality focus)

Prevention activities eliminate the root causes of defects before they can occur. They focus on process design and improvement rather than defect detection.

  • Clear, testable requirements with agreed acceptance criteria
  • Peer reviews and design reviews of work in progress
  • Team training in quality standards and techniques
  • Process standardisation and documentation
  • Root cause analysis of past defect patterns
  • Supplier qualification and pre-qualification
  • Configuration management to prevent unauthorised changes

Cost profile: Lower cost per defect avoided. Prevention investment is front-loaded but reduces total quality cost by eliminating defects before they multiply through the delivery chain.

Inspection (Control Quality focus)

Inspection activities detect defects after work is complete. They provide a quality gate before deliverables are accepted or passed to the next stage.

  • Testing (unit, integration, system, user acceptance)
  • Formal inspections and reviews against specification
  • Statistical sampling of deliverable populations
  • Independent quality audits
  • Control charts monitoring process output
  • Acceptance criteria verification
  • Third-party certification or compliance audits

Cost profile: Higher cost per defect found. Inspection does not eliminate defects. It finds them after they exist. The cost of finding a defect during inspection is always higher than the cost of preventing it in the first place.

Interrelation to Other Knowledge Areas

How Quality Management Connects to Every Other Knowledge Area

✦KA01: Integration Management
The Quality Management Plan is a subsidiary component of the Project Management Plan, governed by Integration Management. All quality-related change requests must pass through integrated change control. When Control Quality identifies a systemic defect requiring a process change, the corrective action is implemented via a change request reviewed by the project board. The direct and manage project work process generates the deliverables that Control Quality then inspects. Non-conformances identified in quality audits (Manage Quality) may trigger exceptions at stage boundary reviews.
✦KA02: Scope Management
Quality and scope are definitionally intertwined. Requirements documents define what the deliverable must do; quality standards define how well it must do it. The acceptance criteria within the scope definition become the verification criteria for Control Quality. Verified deliverables (the output of Control Quality) flow into Validate Scope for formal customer acceptance. A scope change that adds new features must be accompanied by updated quality requirements, the new features need quality specifications just as the original scope did. Scope creep without quality planning creates deliverables with undefined quality standards.
✦KA03: Schedule Management
Schedule pressure is the primary driver of quality shortcuts. When the critical path is compressed, testing and review activities are the first to be shortened or skipped, because their cost is visible and their value is perceived as optional. Quality activities must be explicitly scheduled as activities in the project network with realistic durations, not appended as afterthoughts. Rework resulting from poor quality (defects found late) causes more schedule disruption than the time "saved" by skipping quality activities. Fast-tracking (overlapping sequential activities) increases rework risk, a specific quality risk to be managed.
✦KA04: Cost Management
The Cost of Quality framework directly bridges these two knowledge areas. Prevention and appraisal costs are estimated and budgeted in Estimate Costs as legitimate project cost elements. Non-conformance costs (rework, scrap, warranty) represent unplanned cost that damages CPI. The business case for quality investment is a cost management argument: preventing defects costs less than finding and fixing them. Quality-related change requests (rework, corrective action) require cost impact assessment before approval. A project with poor quality management often has a CPI below 1.0, not because of poor scheduling but because of unplanned rework spending.
✦KA06: Resource Management
Quality management requires skilled resources with the right expertise. Team training (a prevention cost) is both a Resource Management and Quality Management activity. Resource skill gaps directly cause quality defects, an undertrained developer introduces bugs; an inexperienced procurement officer accepts non-conforming supplier deliverables. Quality audits (Manage Quality) assess whether resources are following defined quality processes. Where they are not, training needs identified in the audit feed back into Resource Management's team development activities.
✦KA08: Risk Management
Quality failures are risk events. Quality risks, the risk that a deliverable will fail to meet specification, belong in the Risk Register alongside schedule and cost risks. Risk responses to quality risks include prevention activities (avoid the defect), quality gates (reduce the impact by catching defects early), and contingency reserves for rework (accept with a cost buffer). The relationship flows both ways: poor risk management (unidentified or unmitigated risks materialising) typically causes quality impacts as teams scramble to recover, cutting corners on quality to restore schedule.
✦KA07: Communications Management
Quality reports, audit findings and non-conformance notices are formal communications that must be managed under the Communications Management Plan. Stakeholders have different quality reporting needs: a technical team needs defect density data by component; a steering group needs a red/amber/green quality health summary with trend direction; a customer needs acceptance test results and sign-off documentation. Quality metrics must be communicated clearly to be actionable. Ambiguous quality reporting, where it is unclear whether a metric represents a pass or fail, is itself a quality failure in the communication process.
✦KA09: Procurement Management
Supplier and contractor quality is an extension of project quality management. Procurement contracts must include quality requirements, acceptance criteria and audit rights: otherwise the PM has no formal mechanism to enforce quality standards on external suppliers. Supplier qualification (a prevention cost) reduces the probability of non-conforming deliverables. Incoming inspection of supplier deliverables is an appraisal cost. When a supplier delivers non-conforming work, the consequences, rework, replacement, delay, flow directly into the project's cost and schedule performance. Quality management must explicitly extend to the supply chain, not just internal delivery teams.
Agile and Hybrid Approaches

Quality Management in Agile, Waterfall and Hybrid Environments

Quality Management in Waterfall

In predictive projects, quality management follows the full three-process PMBOK model with formal quality gates at stage boundaries:

  • Quality requirements and metrics defined upfront in Plan Quality Management
  • Quality assurance activities embedded throughout execution phases
  • Formal testing phases (SIT, UAT) scheduled as distinct project stages
  • Quality audits conducted by independent QA function or PMO
  • Stage gate reviews include quality performance assessment
  • Defect management through formal defect tracking systems
  • Quality sign-off required before stage boundary approval
  • Lessons learned on quality fed into OPAs for future projects

Strength: Clear quality governance and formal acceptance gates. Risk: Defects found late in testing phases are expensive to fix, the waterfall model can defer quality feedback until significant rework is already costly.

Quality Management in Agile

Agile approaches quality management fundamentally differently: quality is built in continuously rather than inspected at the end:

  • Definition of Done (DoD): The team's agreed quality checklist that every user story must meet before being marked complete: testing, code review, documentation, acceptance criteria met. The DoD is Quality Management operationalised at sprint level.
  • Test-Driven Development (TDD): Tests written before code is written, ensuring quality requirements are defined before implementation begins: prevention over inspection in its purest form.
  • Continuous integration / continuous testing: Automated tests run on every code commit, providing immediate quality feedback and catching defects within hours of introduction.
  • Sprint retrospectives: PDCA applied to the team's working processes every sprint: identifying quality process improvements and implementing them immediately.
  • Customer/product owner involvement every sprint provides continuous quality feedback
  • No separate "quality phase": quality is validated continuously

Strength: Defects found within the sprint are far cheaper to fix than defects found in a separate testing phase. Risk: Without clear Definition of Done, quality can vary between sprints and teams.

Quality Management in Hybrid Environments

In hybrid projects, the formal quality controls (standards, audit rights, stage gate reviews) stay at the programme level, while delivery teams use agile quality practices inside each sprint. The Definition of Done is the quality gate for each sprint, and the stage review is the quality gate for the programme. Sprint results such as defect counts and test pass rates roll up into the formal quality report.

Exam Tips

Quality Management: 7 Exam Tips for PMP and APM PMQ

1
Quality vs grade: low grade can be fine; low quality never is. The exam often describes a basic or cheap product and asks if this is a quality problem. If the product meets its agreed requirements, it is not. A cheap product that fails its requirements is low quality, and that is always a problem.
2
Prevention beats inspection, every time. When a question asks for the best approach to quality, pick the prevention answer (fix the process, train the team, clarify requirements) over the inspection answer (test more after the work is done). Prevention stops defects. Inspection only finds them.
3
Know the difference between Manage Quality and Control Quality. Manage Quality = process-focused, executing process group, quality assurance, proactive improvement. Control Quality = deliverable-focused, monitoring and controlling, inspection and testing, reactive detection. Manage Quality asks "are our processes working?"; Control Quality asks "does this deliverable meet requirements?" The exam tests this distinction frequently.
4
Control chart Rule of 7: know it cold. Seven or more consecutive data points on one side of the mean (even if all within control limits) signals an out-of-control process requiring investigation. This is called "Rule of 7" and is a specific PMP exam topic. A process can be statistically in control (within UCL/LCL) but still show this pattern, the pattern itself is the signal, not just the control limit breach.
5
Verified deliverables flow into Validate Scope: not the reverse. Control Quality (Quality Management) produces verified deliverables: deliverables confirmed to meet quality standards. These then go to Validate Scope (Scope Management) for formal customer acceptance. The sequence is: quality inspection → verified deliverable → customer acceptance → accepted deliverable. Many candidates confuse which process produces which output.
6
Know the CoQ categories for exam scenarios. Prevention costs (training, process design), appraisal costs (testing, inspection), internal failure costs (rework, scrap) and external failure costs (warranty, recalls). When a question asks about quality costs, categorise each item correctly. Prevention and appraisal = conformance costs. Internal and external failure = non-conformance costs.
7
Precision and accuracy are different. Accurate = close to the target value. Precise = consistent results (low variation), regardless of whether they are near the target. You can be precise without being accurate (consistently wrong), accurate without being precise (right on average but variable), or both. The exam distinguishes between a process needing recalibration (precise but inaccurate) vs process improvement (imprecise).

Worked exam example: which answer would PMI pick?

Here is the kind of question I give my PMP students. Your team keeps finding the same welding defect at inspection. Rework is eating the schedule. What should you do first? A) Add more inspectors. B) Ask the supplier for a discount. C) Do a root cause analysis and fix the process. D) Report the issue to the sponsor.

The answer is C. More inspectors (A) only finds more defects; it does not stop them. B and D do nothing about the cause. When you see a repeated defect, think "process problem, so Manage Quality, root cause, then a change request to fix the process".

Mistakes I see most often in mock exams:

  • Mixing up Manage Quality (process) and Control Quality (deliverable).
  • Thinking a basic, cheap product is a quality problem. It is a grade choice.
  • Choosing "inspect more" when the question is about stopping defects.
  • Forgetting that verified deliverables go to Validate Scope for customer acceptance.

Use This Knowledge Area in Your PMP or APM PMQ Exam

Quality processes, the Cost of Quality and the seven quality tools are tested in both the PMP and the APM PMQ. On the PMP, remember that the 2026 exam is built on the Exam Content Outline and PMBOK 8, not on these PMBOK 6 processes directly. The processes are still the easiest way to learn quality step by step, and the ideas behind them appear in many situational questions.

FAQ

Project Quality Management: 6 Questions Answered

The three PMBOK 6 processes in Project Quality Management (Knowledge Area 5) are: (1) Plan Quality Management (Planning): decide the quality requirements, standards and metrics, and document how you will meet them. Main output: the Quality Management Plan. (2) Manage Quality (Executing): put the plan into action, run quality audits and improve processes. Main outputs: the Quality Report and Test and Evaluation Documents. (3) Control Quality (Monitoring and Controlling): inspect, test and measure deliverables and record the results. Main outputs: Verified Deliverables and Quality Control Measurements. In short, Manage Quality looks at the process, Control Quality looks at the product.
Quality means meeting the requirements. Grade is a category for products that do the same job but have different features. A budget hotel is low grade and a five-star hotel is high grade. Low quality is always a problem because the product does not do what was agreed. Low grade is not a problem if the customer asked for it. A basic hotel room that is clean and matches its description is high quality at low grade. An expensive room that keeps letting guests down is low quality at high grade.
The Cost of Quality puts quality costs into two groups. Conformance costs are what you spend to get it right: prevention (training, process design, quality planning, peer reviews) and appraisal (testing, inspection, audits). Non-conformance costs are what you spend because it was not right: internal failure (rework, scrap, retesting) found before delivery, and external failure (warranty claims, recalls, complaints) found after delivery. The rule to remember: the later a defect is found, the more it costs, so money spent on prevention gives the best return.
The seven basic quality tools are: (1) Cause-and-effect diagram (fishbone or Ishikawa): groups possible causes of a problem to find the root cause. (2) Control chart: plots results over time against control limits to show whether a process is stable. (3) Flowchart: shows the steps of a process and where defects can enter. (4) Histogram: shows how often each value occurs, so you can see variation. (5) Pareto chart: ranks problems by frequency so you fix the biggest ones first (the 80/20 rule). (6) Scatter diagram: plots two variables to see if they are related. (7) Checklist or check sheet: a simple way to confirm steps are done or to count defects.
In predictive (waterfall) projects, quality follows the three processes with formal quality gates: requirements are set early, quality assurance runs during execution, and testing phases check deliverables at set points. In agile, quality is built in all the time. The Definition of Done is the quality checklist every user story must meet. Test-driven development writes the tests before the code. Automated testing gives feedback within hours, and retrospectives apply PDCA every sprint. The main difference: waterfall often treats quality as a phase, while agile makes it part of everyone's daily work.
The Rule of 7 (a run rule) says that if seven or more points in a row fall on the same side of the mean on a control chart, the process is out of control and you should investigate, even if every point is inside the control limits. Seven points in a row on one side is very unlikely to happen by chance (0.57 is about 0.78%), so something real is affecting the process. On the PMP exam, if you see this pattern, the answer is to investigate the cause.