
The precedence diagramming method (PDM) is a scheduling technique that shows project activities as boxes, or nodes, connected by arrows that represent their dependencies. Also called activity on node, it supports 4 dependency types, leads and lags, and is the basis for calculating the critical path with forward and backward passes.
In project management, the success of any project depends mainly on the ability of the project manager to plan and execute tasks effectively. One of the most popular techniques used for project planning is the Precedence Diagramming Method (PDM), also known as the Activity on Node (AON) method. PDM is a visual scheduling tool that uses a graphical network to represent project tasks and their dependencies. This article will discuss the Precedence Diagramming Method in detail, its benefits, and how it can be used in project management.
What is the precedence diagramming method?
Precedence Diagramming Method (PDM) is a network diagramming technique used in project management. The process is used to identify the sequence of activities required to complete a project. The method employs a graphical representation of the project activities, including their dependencies and interrelationships. The PDM model represents the activities as nodes and the relationships as links.
The PDM diagram depicts the critical path, which is the sequence of actions that must be completed to finish the project on time. In PDM, the activities are represented by boxes, and arrows represent the dependencies. The arrows indicate the flow of activities from one task to another.
What are the benefits of PDM?
The Precedence Diagramming Method has several benefits in project management, some of which include the following:
- Improved project planning: PDM visually represents the project activities, making it easy to identify dependencies and relationships between tasks. This helps in better project planning and scheduling.
- Improved project communication: PDM enables project teams to clearly and concisely communicate project activities and their relationships, leading to a better understanding of project requirements and expectations.
- Improved project management: PDM helps project managers monitor progress, identify delays, and make necessary adjustments to keep the project on track.
- Improved risk management: PDM helps identify potential risks in the project by highlighting critical tasks and dependencies. This enables project managers to take necessary measures to mitigate risks.

How do you build a precedence diagram?
The Precedence Diagramming Method involves several steps to develop a comprehensive PDM diagram. These steps include:
- Define the project scope: The first step in PDM is to define the project scope, objectives, and requirements. It will help in identifying the project activities and their relationships.
- Identify project activities: The next step is identifying all the actions required to complete the project. These activities should be placed systematically and logically, considering their dependencies and relationships.
- Determine activity dependencies: Once the activities have been identified, the next step is to determine their dependencies. This involves identifying the actions that must be completed before other activities begin.
- Develop the PDM diagram: The diagram is developed by representing each activity as a node and connecting the nodes with arrows to indicate their dependencies. The diagram also shows the duration of each activity and the critical path.
- Identify the critical path: The essential way is the sequence of activities that must be completed on time to ensure the project is on schedule. It is identified by identifying the PDM diagram’s most extended series of activities.
- Calculate activity durations: The duration of each activity is calculated based on the resources required, the complexity of the task, and other factors that may affect the time.
- Monitor project progress: Once the PDM diagram has been developed, it is essential to monitor project progress regularly to ensure that the project is on track. It involves tracking the completion of each activity and identifying any delays or issues that may arise.
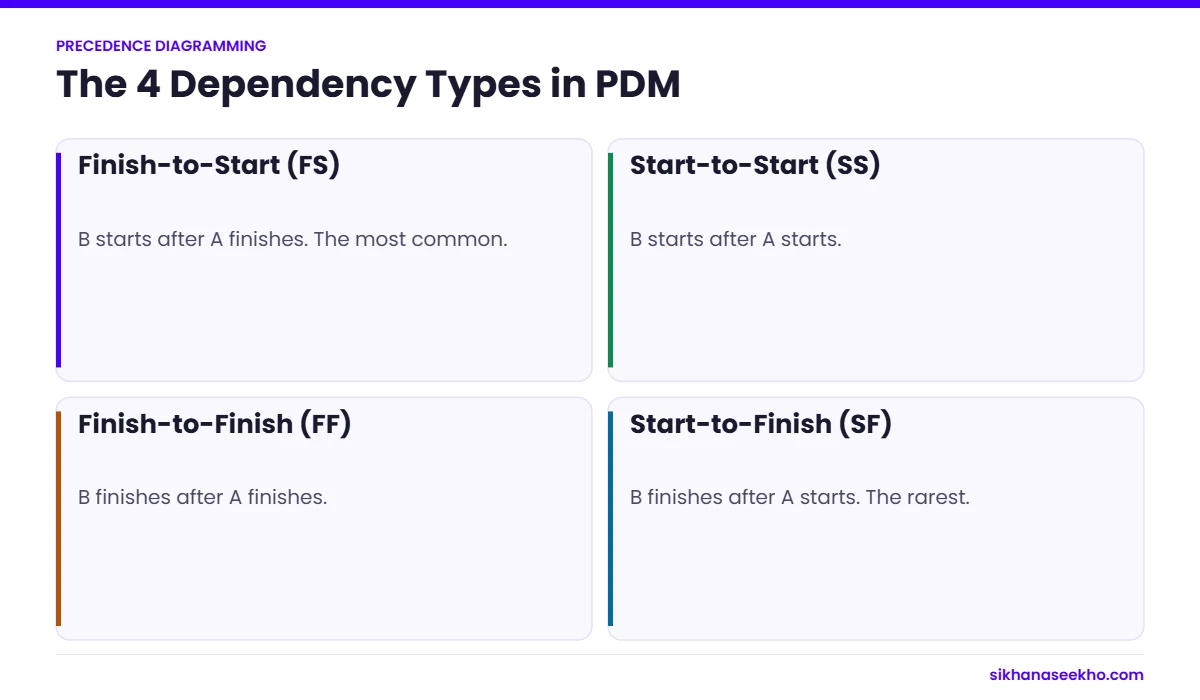
The 4 dependency types in PDM
| Type | Rule | Example |
|---|---|---|
| Finish-to-start (FS) | B cannot start until A finishes | Pour the foundation before building walls |
| Start-to-start (SS) | B cannot start until A starts | Start editing once writing has started |
| Finish-to-finish (FF) | B cannot finish until A finishes | Testing cannot finish until coding finishes |
| Start-to-finish (SF) | B cannot finish until A starts | The old shift cannot end until the new shift starts |
Finish-to-start is by far the most common. Source: PMBOK Guide (PMI).
A worked example
Take 4 activities. A takes 3 days and starts the project. B takes 5 days and follows A. C takes 4 days and also follows A. D takes 2 days and follows both B and C.
There are 2 paths. A–B–D takes 3 + 5 + 2 = 10 days. A–C–D takes 3 + 4 + 2 = 9 days. The longest path, A–B–D, is the critical path, so the project takes 10 days.
Activity C has 1 day of total float: it can slip by 1 day without delaying the project. Any delay to A, B or D delays the finish date.
Forward pass: A runs days 1 to 3; B days 4 to 8; C days 4 to 7; D starts after the later of B and C, so it runs days 9 to 10. Backward pass from day 10 gives C a late finish of day 8, which is where its 1 day of float comes from.
Leads and lags
A lag adds waiting time between activities. For example, concrete may need a 7-day curing lag before the next activity starts. A lead lets a successor start early, such as starting documentation 2 days before testing finishes.
Use leads and lags carefully and document why. On the PMP exam, remember that a lag is a delay and a lead is an acceleration, and both can apply to any of the 4 dependency types.
PDM in practice
Most scheduling tools, including Microsoft Project, Primavera P6 and the Gantt views in many online tools, use PDM behind the scenes. You enter activities, durations and dependencies; the software draws the network and calculates the critical path.
Even so, it is worth drawing a small network by hand at least once. It builds intuition for float and the critical path, which helps you challenge unrealistic schedules. In 2026, PDM remains a core topic for the PMP and APM exams, and a daily tool for planners on projects of every size.
A larger example with 12 activities
On real projects, networks quickly grow. A small office fit-out might have 12 activities: survey, design, approvals, ordering furniture, ordering IT equipment, strip-out, electrical work, data cabling, decoration, furniture installation, IT installation and handover. Several run in parallel, and the critical path might run through approvals, strip-out, electrical work, decoration and furniture installation, totalling around 35 working days.
Drawing the network shows which activities have float, such as ordering IT equipment, and which do not. It also shows where a lag is needed, for example 10 working days for furniture delivery after ordering.
If the client wants to finish 5 days earlier, the network tells you where to look: only activities on the critical path can shorten the project, either by crashing them with extra resources or by fast-tracking them to run in parallel. Shortening an activity with float achieves nothing.
Conclusion
The Precedence Diagramming Method is a powerful tool in project management that helps project teams plan, schedule, and execute tasks more effectively. By representing project activities and their dependencies in a visual format, PDM provides a clear understanding of project requirements and expectations. PDM also enables project teams to communicate project activities and their relationships more effectively, leading to better collaboration and teamwork.
In conclusion, the Precedence Diagramming Method is a valuable technique in project management that project managers should use to improve project planning, communication, and execution. By following the steps involved in PDM, project managers can develop comprehensive PDM diagrams that represent project activities and their dependencies clearly and concisely. That enables project teams to complete projects on time, within budget, and with the desired quality.
Parametric Estimating is recommended for all those who are interested in all latest things happening in the world!
Precedence diagramming method: common questions
What is the difference between PDM and ADM?
PDM (activity on node) shows activities as boxes and supports 4 dependency types. ADM (activity on arrow) shows activities as arrows, supports only finish-to-start and may need dummy activities. PDM is the modern standard.
What is the critical path?
The longest path through the network. It sets the shortest possible project duration, and its activities have zero total float.
What is total float?
How long an activity can be delayed without delaying the project finish. It equals late start minus early start.
Keep learning
- How to Draw a Context Diagram: Step by Step with an Example
- Data Representation Techniques: Which Chart for Which PMP Question
- Communication Requirements Analysis in Project Management: Step-by-Step Guide
- Who Should be Involved in Communications Planning?
- Project Management Artifacts in PMBOK 7: Full Artifact List for 2026
- Engagement Model in Project Management