
Data representation means showing project data as charts, diagrams and tables so people understand it quickly. For the PMP exam, the skill that matters is choosing the right one: a Gantt chart for “when”, a network diagram for “what depends on what”, a flowchart for “how the process runs”, a Pareto chart for “which causes matter most” and a burndown chart for “are we on track this sprint”.
Table of contents
Every chart answers one question. If you pick the wrong chart, your sponsor gets confused and your exam answer is wrong. On this page I go through the main project management data representation tools: Gantt charts, flowcharts, network diagrams, tables and spreadsheets, plus the agile and quality charts you need for the exam. For each one you will see what it shows and how to build it.
This page is about choosing the right chart for each kind of PMP question. If you want a picture-by-picture walk-through of every diagram you might see on the exam, read my PMP exam diagrams page.
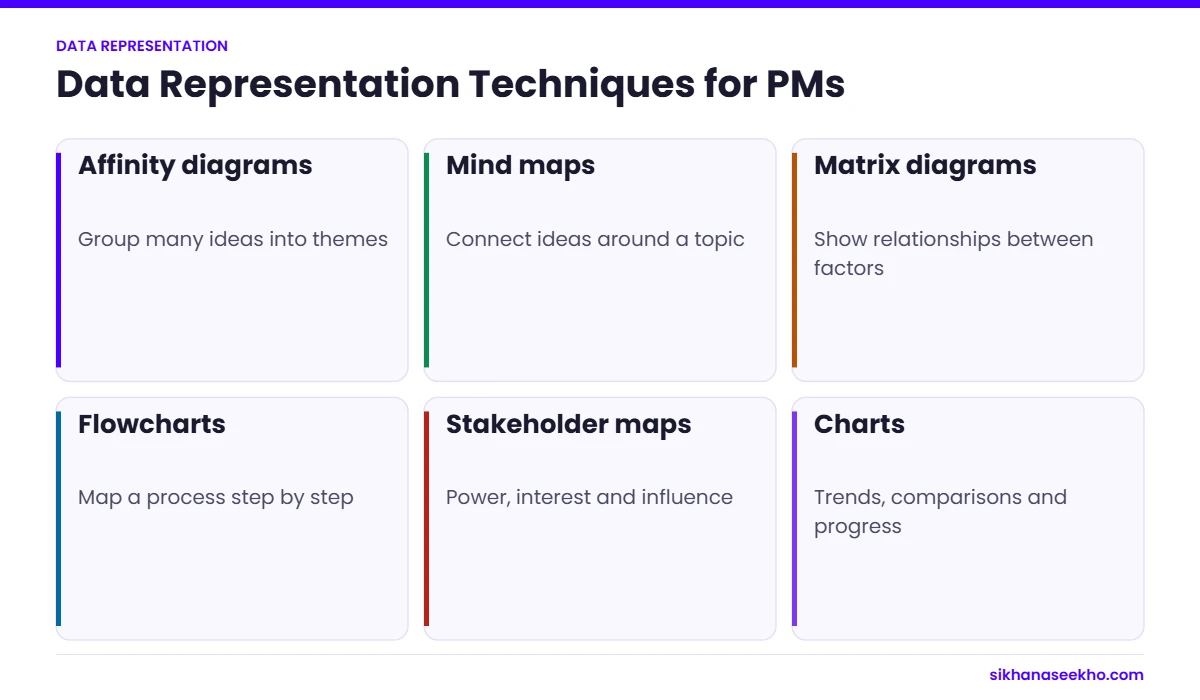
What are the main data representation techniques?
Here are the main techniques, with a short how-to for each. Read the “what it shows” part first. The steps matter less for the exam, but they help on real projects.
What is a Gantt chart?
A Gantt chart shows tasks as bars against a timeline. You see what happens when, how long each task takes and, in most tools, the links between tasks. It is the most common way to show a schedule to stakeholders. Use it when the question is “when will it be done?”
How to make a Gantt chart:
Step 1: Define Your Project Tasks and Milestones
List the tasks and the key milestones. Use your WBS as the starting point so nothing is missed.
Step 2: Determine Task Dependencies
Decide the order. Which task must finish before another can start? These links later show you the critical path: the longest chain of tasks, which sets the shortest possible project duration.
Step 3: Estimate Task Durations
Estimate how long each task takes. Split big tasks so the estimates are realistic, and think about resources and risks.
Step 4: Choose a Gantt Chart Tool
Pick a tool. Excel or Google Sheets work for small projects. Microsoft Project, Primavera P6 or online tools suit bigger ones.
Step 5: Set Up Your Gantt Chart
Set the timeline across the top and the tasks down the side. Choose a time scale (days, weeks or months) that fits the project length.
Step 6: Enter Task Details
Enter each task with its start and end dates. Mark milestones with a diamond or another clear symbol.
Step 7: Define Task Dependencies
Link related tasks so the tool shows the sequence. Check the links match how the work really happens on the ground.
Step 8: Adjust Task Durations and Resource Allocation
Adjust durations and resources until the plan is realistic. Look for people who are overloaded and tasks with no slack.
Step 9: Review and Finalize the Gantt Chart
Check the chart for gaps, wrong links and missing milestones before you share it.
Step 10: Share and Communicate the Gantt Chart
Share it and keep it updated. An out-of-date Gantt chart is worse than none, because people trust it.
Flowcharts
A flowchart shows the steps of a process and the decisions along the way. Use it when the question is “how does this process work?” or “where does it get stuck?” In PMBOK 6 it is one of the quality tools, so expect it in quality questions.
How to make a flowchart:
Step 1: Define the Process or Workflow
Pick one process, for example “approving a design change”. Write down the steps and the decision points in order.
Step 2: Determine Flowchart Symbols
Use the standard symbols:
Start/End: Represented by a rounded rectangle or oval shape to indicate the beginning or end of the process.
Process: Represented by a rectangle to indicate a specific action or task.
Decision: Represented by a diamond shape to indicate a decision point with multiple possible outcomes.
Connector: Represented by a circle or oval shape to connect different parts of the flowchart.
Arrow: Used to show the direction of flow between steps or decision points.
Step 3: Select a Flowchart Tool
Pick a tool. Visio, Lucidchart, draw.io, PowerPoint or a whiteboard are all fine.
Step 4: Set Up Your Flowchart
Open a blank page and set the size and direction (top to bottom or left to right).
Step 5: Add Flowchart Symbols
Place the start symbol, then a box for each step, a diamond for each decision and the end symbol.
Step 6: Define Flowchart Logic
Connect the symbols with arrows in the order the work flows. Every decision needs at least two exits, such as “yes” and “no”.
Step 7: Test and Validate the Flowchart
Walk through the chart with the people who do the work. They will spot missing steps quickly.
Step 8: Revise and Finalize the Flowchart
Fix what they found and keep it simple. If it does not fit on one page, split it.
Step 9: Share and Communicate the Flowchart
Share it with the team and use it to discuss bottlenecks and improvements. Update it when the process changes.
Network Diagrams
A network diagram shows activities as boxes linked by arrows, so you can see which activity depends on which. Use it when the question is about dependencies, float or the critical path. On the PMP exam, this is the chart behind most critical path calculations.
How to make a network diagram:
Step 1: Define Your Project Activities
List all activities from your WBS. Each one should be a clear piece of work with a duration.
Step 2: Determine Activity Dependencies
Set the dependency for each pair: finish-to-start (the most common), start-to-start, finish-to-finish or start-to-finish. The critical path is the longest chain of dependent activities, and it sets the shortest possible project duration.
Step 3: Choose a Network Diagram Format
Use the Precedence Diagramming Method (PDM). PDM is an activity-on-node (AON) format: each activity is a box (node) and the arrows show the dependencies. Older activity-on-arrow diagrams are rarely used now.
Step 4: Select a Network Diagram Tool
Pick a tool. Microsoft Project and Primavera P6 draw the network for you. Visio, Lucidchart or draw.io are fine for a manual drawing.
Step 5: Set Up Your Network Diagram
Set up a blank page with enough space to lay out activities from left to right.
Step 6: Add Project Activities
Add each activity as a box with an ID, a short name and its duration. Place them from left to right in rough time order.
Step 7: Define Activity Dependencies
Connect the boxes with arrows that show the dependencies. Note any lead or lag on the arrow.
Step 8: Analyze the Network Diagram
Do a forward pass and a backward pass to find early and late dates and the float. Activities with zero float form the critical path. These are the ones to watch most closely.
Step 9: Revise and Finalize the Network Diagram
Check the logic with the team. Every activity except the first should have a predecessor, and every one except the last a successor.
Step 10: Share and Communicate the Network Diagram
Share it with the team and update it when the plan changes. Use it to explain why some delays matter and others do not.
Tables and Spreadsheets
Tables and spreadsheets hold the detail: budgets, registers, logs and resource lists. Use them when the reader needs exact figures rather than a picture. Most project registers, such as the risk register and issue log, are simply well-designed tables.
How to use tables and spreadsheets well:
Step 1: Identify Data Requirements
Decide what you need to track: tasks, costs, risks, resources or progress. Do not track data nobody will use.
Step 2: Choose the Right Tool
Pick a tool. Excel and Google Sheets cover most needs. Smartsheet or your project tool may be better for shared live data.
Step 3: Design the Table or Spreadsheet Layout
Plan the columns before you type. Use clear headers and one row per item.
Step 4: Enter Project Data
Enter the data carefully and keep the same format throughout, especially for dates.
Step 5: Format and Customize
Use simple formatting, such as bold headers and one colour for items that need attention. Too many colours confuse readers.
Step 6: Use Formulas and Functions
Use formulas for totals, variances and percent complete, so the numbers update themselves.
Step 7: Create Charts and Graphs
Turn key figures into a simple chart when stakeholders need to see a trend rather than a number.
Step 8: Regularly Update and Maintain
Update it on a fixed rhythm, for example weekly, so people know it is current.
Step 9: Share and Collaborate
Share it in one place, such as a shared drive, so everyone works from the same version.
Step 10: Review and Analyze
Review it with stakeholders regularly and act on what it shows.
FAQs
They are the ways you show project information, such as schedules, costs, risks and progress, as charts, diagrams and tables so people can understand it quickly.
Because people decide faster when they can see the data. A good chart shows a trend or a problem in seconds, and it keeps all stakeholders looking at the same picture.
Gantt charts, network diagrams, flowcharts, histograms, Pareto charts, burndown charts, tables and spreadsheets. Each one answers a different question.
A Gantt chart is a bar chart of tasks against a timeline. It shows when each task starts and ends, the milestones and, in most tools, the links between tasks. It is the usual way to show a schedule to stakeholders.
A network diagram shows activities and their dependencies. You use it to find the critical path and the float, and to see which delays will push out the end date.
A flowchart shows the steps and decisions in a process. It helps you find bottlenecks and explain a process to new team members.
Tables and spreadsheets hold detailed figures such as budgets, resources and registers. They are the basis for most reports and many charts.
Which data representation tool to use
| Tool | Shows | Best used for | PMP exam link |
|---|---|---|---|
| Gantt chart | Tasks against a timeline | Schedules and progress reporting | Schedule management |
| Flowchart | Steps and decisions in a process | Explaining workflows and quality checks | Quality management (one of the 7 basic quality tools) |
| Network diagram | Dependencies between activities | Finding the critical path | Critical path method |
| Table or spreadsheet | Detailed figures | Budgets, registers and logs | Cost and risk management |
| Burndown chart | Work remaining over time | Agile sprints | Agile and hybrid delivery |
| Pareto chart | Causes ranked by frequency (80/20 rule) | Prioritising defects or issues | Quality management |
How do these tools appear on the PMP exam?
The PMP exam rarely asks you to draw a chart. It shows you one, or describes a situation, and asks what it means or which tool to use. Expect to read a Gantt chart, find the critical path on a network diagram and pick the right quality tool, such as a Pareto chart, which applies the 80/20 rule.
Burndown and burnup charts appear in agile and hybrid questions. Learn to read whether a team is ahead of or behind its sprint goal from the slope of the line.
Which chart for which question: exam cues
- “Which activities have zero float?” or “What is the project duration?” Network diagram.
- “The sponsor wants a simple view of when work will happen.” Gantt chart.
- “Most defects come from a few causes. Which tool shows this?” Pareto chart.
- “How often does each type of defect occur?” Histogram.
- “Is the process stable over time?” Control chart.
- “What could be causing this problem?” Cause and effect (fishbone) diagram.
- “Work remaining in the sprint is not going down.” Burndown chart.
- “Who interacts with the system and what flows in and out?” Context diagram.
When I teach this to my PMP students, the mistake I see most is mixing up the histogram and the Pareto chart. Both are bars. The Pareto chart is sorted from biggest to smallest and usually has a cumulative line, because its job is to show which few causes to fix first.
About 60% of the current PMP exam covers agile or hybrid approaches, so give agile charts as much study time as traditional ones. Practise reading several charts of each type before exam day.
Which technique should you use?
Start from the question, not the tool. When? Gantt chart. What depends on what? Network diagram. How does the process run? Flowchart. Which causes matter most? Pareto chart. Are we on track this sprint? Burndown. Need exact figures? Table. Learn this mapping and most data representation questions become easy marks.
Keep learning
- Communication Requirements Analysis in Project Management: Step-by-Step Guide
- Who Should be Involved in Communications Planning?
- Project Management Artifacts in PMBOK 7: Full Artifact List for 2026
- Engagement Model in Project Management
- PMBOK Guide 6th Edition Explained
- PMBOK Guide 7th Edition Explained