
Project managers use a context diagram (CD) as a graphical tool to illustrate the interactions between a project and its external environment. It consists of a project entity in the center and external entities surrounding it, connected by arrows indicating the flow of information or materials. The CD helps project managers identify key stakeholders, communicate project scope, and plan more effectively.
Context Diagram
Project managers use a context diagram as a graphical tool to illustrate the interactions between a project and its external environment.. This high-level overview can provide project managers with a better understanding of the project’s scope, stakeholders, and potential issues.
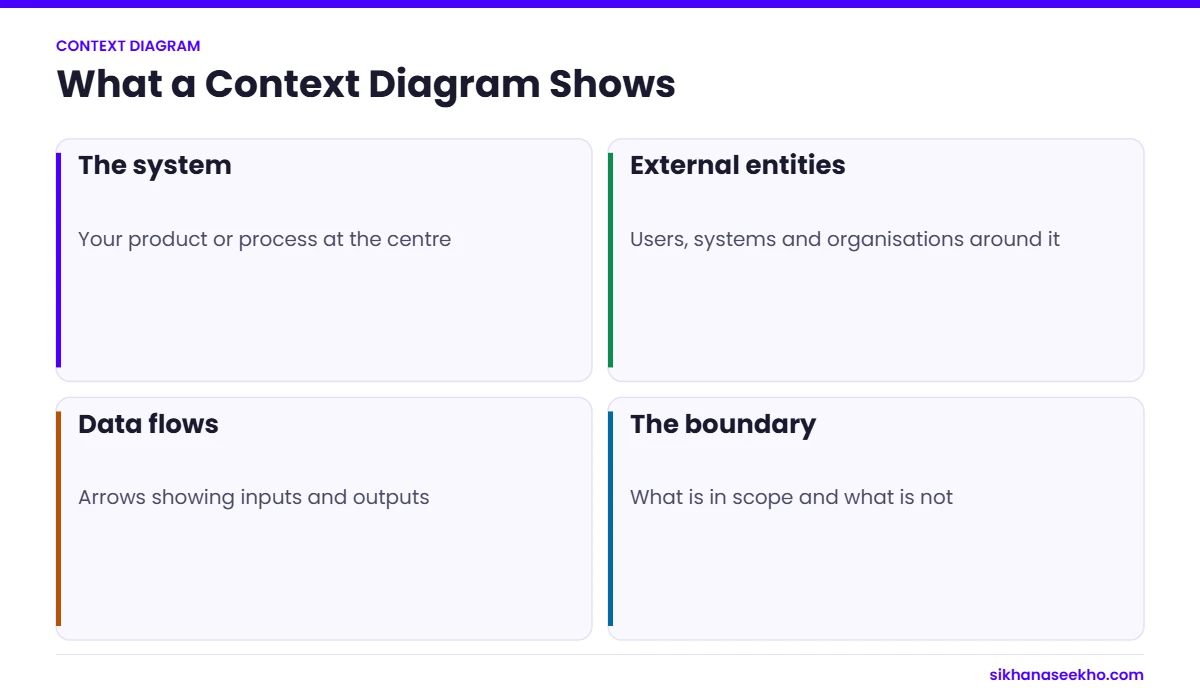
Components of a Context Diagram
A CD typically consists of three main components: the project entity, external entities, and arrows indicating the flow of information or materials.
Project Entity
Project managers depict the project entity as a circle or square in the center of the diagram to represent the project being managed. They may also refer to the project entity as the system under development.
External Entities
“Project managers show external entities as rectangles surrounding the project entity. They can represent any external system, organization, or individual interacting with the project. Examples of external entities include customers, suppliers, regulatory agencies, and other departments within the same organization.
Arrows
Arrows indicate the flow of information or materials between the project entity and external entities. These arrows can show the direction of communication, data flow, or resource allocation. In a context diagram, project managers use arrows to provide a high-level view of the project’s interactions with its environment. The arrows do not show specific details of what is being exchanged.

Benefits of a Context Diagram
A context diagram can provide numerous benefits for project managers, including:
- Identifying key stakeholders: A CD can help project managers identify the key stakeholders and their relationships with the project. It can help them anticipate potential issues or conflicts and plan accordingly.
- Communicating project scope: The context diagram can communicate the scope to stakeholders who may need a deeper understanding of the project’s details. It can help them see how the project fits into the larger picture and how it may impact their work or organization.
- Better planning: By using a CD, project managers can better understand the project’s environment and stakeholders. This can help them plan the project more effectively and efficiently.
How to create a context diagram in five steps
- Name the system. Place your project, product or process in a single box or circle at the centre.
- List every external entity. Think about customers, users, suppliers, regulators, other internal systems and departments.
- Draw the flows. Add an arrow for each piece of information, material or money that moves between an entity and the system. Label each arrow.
- Check the boundary. Anything inside the central box is in scope; everything outside is not. Confirm this with your sponsor.
- Review with stakeholders. Walk through the diagram with the people represented on it. Missing flows usually surface quickly.
A simple example
Imagine a project to build an online booking system for a clinic. The system sits at the centre. Around it are patients (who send booking requests and receive confirmations), clinic staff (who manage availability), a payment provider (which receives payment requests and returns approvals) and an SMS service (which sends reminders). Each relationship is one labelled arrow, and the whole picture fits on one page.
Common mistakes to avoid
- Showing internal processes inside the system. A context diagram shows only the system as a single unit.
- Unlabelled arrows. Every flow should say what moves.
- Missing indirect stakeholders such as regulators or auditors.
- Treating the diagram as final. Update it when scope changes.
Context diagrams on the PMP exam
The PMP exam can present a context diagram and ask what it shows. Remember that it is a scope tool used when collecting requirements and defining scope. See our guide to PMP exam diagrams for how it compares with other visuals, and our project scope management guide for where it fits in the process.
Conclusion
A context diagram is a simple yet effective tool for project managers to gain a high-level understanding of their project’s environment and stakeholders. Using this tool, they can better plan and communicate their project’s scope to all parties involved, leading to a more successful project outcome.